Ecosystem functions and services
How Target 3 Considers Ecosystem Functions and Services in Area-Based Conservation
Ecosystem Functions and Services in the Context of Target 3
What are ecosystem services?
Target 3 emphasises ecosystem services and adds “ecosystem functions,” not present in previous Convention on Biological Diversity (CBD) objectives, without a very clear definition of what this means. The addition of “ecosystem functions” indicates that part of the aim should be to maintain underlying ecosystem health on a wider scale, rather than just those elements that are immediately translatable into human values.
Occasionally trade-offs may need to be made between emphasizing ecosystem services and conserving biodiversity, although there is strong evidence that areas of high biodiversity also supply proportionately more ecosystem services. Note that the definitions of both protected areas and Other Effective Area-based Conservation Measures (OECMs) focus on the conservation of biodiversity, and ecosystem functions and services are “associated” with biodiversity. This is because functioning ecosystems sustain the ecological processes that drive the services humanity depends on. Thus, it is appropriate that biodiversity values are the key selection criteria for protected and conserved areas (PCAs). Protected areas are designated for their biodiversity conservation values, and many also have other ecosystem service values. Many OECMs may be managed for other ecosystem services values, such as water services or carbon storage, but it is the association with biodiversity that provides the services and OECMs are only recognized as OECMs if they provide significant biodiversity benefits.
Mapping ecosystem services
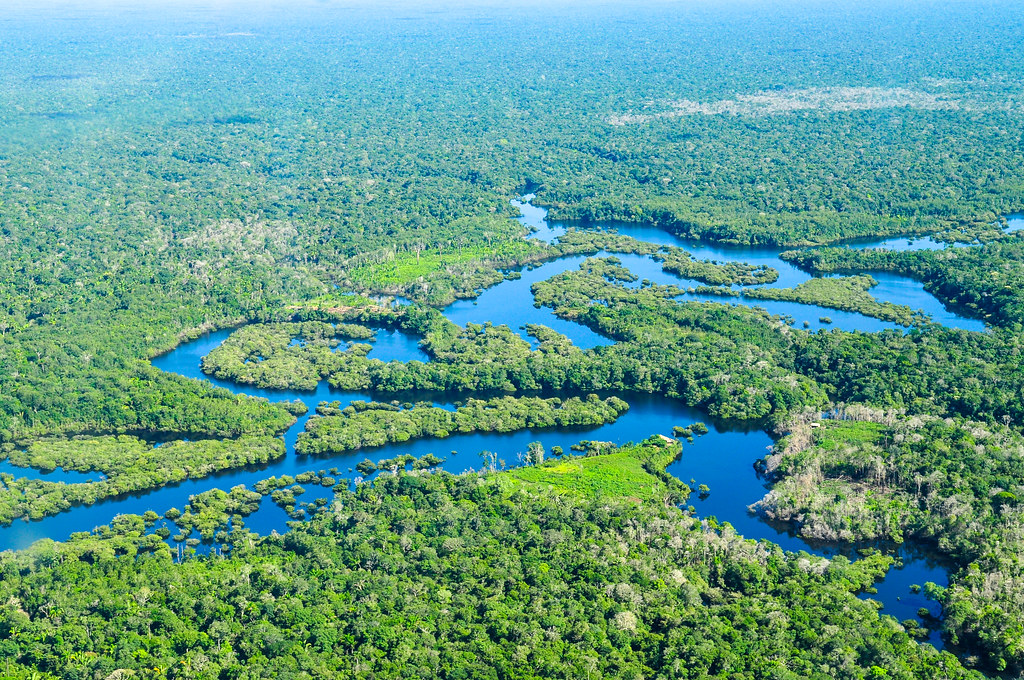
Critical Natural Assets mapping illustrates the global distribution of ecosystems providing services related to water quality regulation (nitrogen, sediment), food provision (pollination, grazing, riverine and marine fish), timber and fuel production, flood regulation and coastal risk reduction, and access to marine and terrestrial areas for recreation and gathering of resources. The ocean generates 50 percent of the oxygen we need, absorbs 25 percent of all carbon dioxide emissions and captures 90 percent of the excess heat generated by these emissions.
The UN Biodiversity Lab provides decision-makers with spatial data to put nature at the center of sustainable development. It includes a collection on protected areas with more than 20 different data layers that users can explore to query key questions related to protected areas.
Managing ecosystem services
From the perspective of planning, ecosystem services come in two main types, those immediately valuable to people living in or near the site and those with wider, possibly global, significance but that are less recognizable at a local level. Thus, access to fish populations is easy to understand and appreciate at a community level whereas the carbon value of a peatland is much harder to comprehend and bring into negotiation about land use locally.
Ecosystem functions and services should also be understood in a way that reflects the diverse values of nature, including relational values and biocultural diversity. Planning for ecosystem services – such as food and water security, disaster risk reduction, health benefits and climate adaptation and mitigation and cultural values and services – therefore depends on two types of assessment, a) finding out what local people think is important and b) determining wider global values provided by nature that help maintain life on the planet, including values and benefits such as genetic materials and ecosystem processes that may yet be discovered.
Tools are available for both these types of assessment, ranging from analysis of satellite imagery to workshop approaches with local people. These can include economic valuation, although methodologies are imperfect and decisions are seldom made purely on financial terms. A 2022 IPBES report also offers guidelines on valuation and policy making in relation to diverse values of nature.
“Transformative change needed to address the global biodiversity crisis relies on shifting away from predominant values that currently over-emphasize short-term and individual material gains, to nurturing sustainability-aligned values across society.” – Summary for Policymakers
Enabling factors and challenges
Although there are many examples of partnerships around the world between PCAs and institutions such as water companies, municipalities, health departments, tourism ventures, etc., the role of natural ecosystems in maintaining ecosystem services has still failed to come to scale, or to enter mainstream thinking with the seriousness needed for effective uptake. The combination of the new GBF, elements of the UNFCCC climate strategy and the UN SDGs may be sufficient to give the necessary push, but it is essential that implementors communicate messages about this connection to the broader public.
Tools for measuring, modelling, and valuing ecosystem services: Guidance for Key Biodiversity Areas, natural World Heritage sites, and protected areas
https://portals.iucn.org/library/sites/library/files/documents/PAG-028-En.pdf
This resource provides guidance to practitioners on existing tools that can be applied to measure or model ecosystem services (ES) specifically provided by important biodiversity and nature conservation sites such as Key Biodiversity Areas, natural World Heritage sites, and protected areas. The guide compares nine selected ES tools in the main text (additional tools are in the Annex) that are divided into two types: written step-by-step tools and computer-based modelling tools. Three of the tools—Ecosystem Services Toolkit, Protected Areas Benefits Assessment Tool, and Toolkit for Ecosystem Service Site-based Assessment v2.0—are PDF documents. The other six—Artificial Intelligence for Ecosystem Services, Co$ting Nature v.3, Integrated Valuation of Ecosystem Services and Tradeoffs 3.4.2, Multiscale Integrated Models of Ecosystem Services, Social Values for Ecosystem Services, and WaterWorld v.2—include both software and web-based tools.
The publication contains five main sections: 1. Introduction; 2. Overview of Key Biodiversity Areas, natural World Heritage sites, and protected areas; 3. Why measure, model, or value ecosystem services delivered by sites?; 4. Comparison of ecosystem services tools, and 5. Summary: Key differences between tools. It also contains four annexes that include additional information on ES assessments and case studies.
Key Take Aways:
- Selecting the right tool to assess ecosystem services (ES) is determined by three key factors: the purpose of the assessment, the required outputs, and practical considerations such as the level of expertise, time, and data needed.
- There are many reasons to measure the ES provided by sites such as Key Biodiversity Areas, World Heritage sites, and Protected Areas, related to public/policy support, site management, human well-being, planning, private sector engagement, funding and investment, and knowledge generation.
- Qualitative tools may be better for scoping and identification, whereas quantitative tools may be more helpful if specific data are needed in pressurising situations related to water use or land conversion, for example. A combination of both can also be powerful for a broader view of the ES. Nonetheless, all of the tools provide an opportunity to understand issues related to ES and support policy and management decisions.
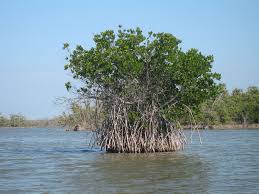
The Blue Carbon Handbook offers essential information about blue carbon as a nature-based solution to sequester carbon dioxide, support biodiversity, and provide socioeconomic benefits including resilience and livelihood support.
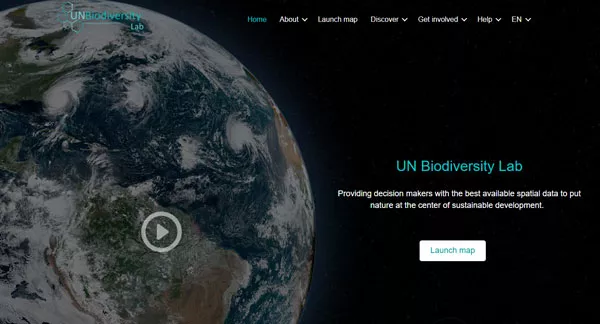
The UN Biodiversity Data Lab provides decision makers with the best available visualizations and spatial data to put nature at the center of sustainable development through planning, monitoring, and reporting worldwide.
“Mapping the planet’s critical natural assets” defines critical natural ecosystem assets and maps their global locations. Findings show prioritizing these assets could advance climate and conservation goals.
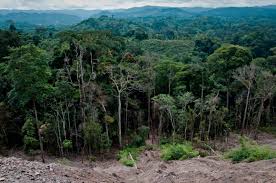
The study “Mapping the irrecoverable carbon in Earth’s ecosystems” maps globally distributed irrecoverable carbon in ecosystems, identifying vulnerable carbon stocks, and highlighting priority regions for protection.